TL;DR
- XRP gains 9% daily after Ripple settles with SEC, boosting confidence across crypto markets.
- Whale wallets show mixed signs; exchange reserves fall while large transfers remain unusually high.
- XRP holds above $3.20 support with bullish momentum; RSI nears overbought, but trend still intact.
- The following presents multiple Ripple (XRP) price predictions given the above context.
Ripple (XRP) Price Predictions: The Context
In the last 24 hours, XRP has posted a sharp move higher. At the time of writing, the token trades around $3.31, representing a 9% daily gain. The price increase places XRP just below its yearly high of $3.65, a level touched three weeks earlier.
For the week, XRP is now up more than 13%. During this period, the price has fluctuated between $2.77 and $3.36, while the past day saw a range between $3.03 and $3.37. Daily trading volume is also up, with more than $9.9 billion exchanged across major platforms.
Notably, these movements come directly after Ripple finalized a legal settlement with the United States Securities and Exchange Commission. The deal ended a lengthy legal case that started in 2020. No further appeals will follow. With the case now behind the company, many traders and investors have adjusted their outlook on XRP.
Market Responds to Institutional Activity
Soon after the legal resolution became public, transaction monitors flagged a large XRP transfer. More than 16.6 million XRP, valued at over $55 million, moved to Coinbase from an unrecognized wallet. This transfer was one of the largest seen in recent months.
Interestingly, the transaction coincided with a surge in trading volume. Price moved quickly through areas of prior resistance. XRP cleared the $3.10 to $3.15 zone with high volume.
Buying pressure has been steady, supported by higher-than-normal inflows during the early hours of trading on August 8. This price strength has been attributed to renewed interest from institutional traders.
Technical Picture: Holding Support, Aiming Higher
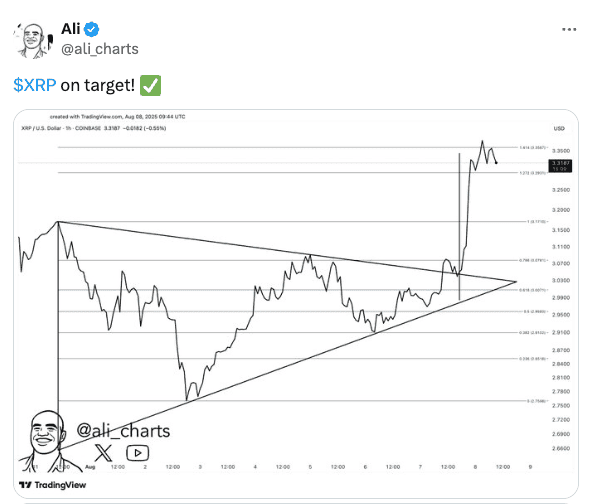
Charts suggest XRP is still within a bullish structure. The price broke out of a falling wedge pattern that had formed after a mid-July peak. The breakout occurred near $3.07, which lines up with the 0.786 Fibonacci retracement level. A quick move followed, pushing the token up to $3.35 before slight retracement.
Now, the token is consolidating near $3.31. This price region is close to the 0.618 Fibonacci level, which has acted as a key zone in previous cycles. If the market holds above $3.20, there may be enough momentum to challenge $3.65 again and even push toward $4.
Support is currently found at $3.20 and $3.00. If the XRP price fails to hold these levels, a deeper pullback could reach the $2.72 area. This level previously saw strong demand in late July and may act as a base if needed.
The Relative Strength Index (RSI) is now at 67.9. This level shows growing buying interest but is not yet in overbought territory. If RSI moves past 70, traders may expect consolidation before any continuation.
Earlier, market analyst Ali Martinez pointed to a successful breakout from the 0.786 to the 1.414 Fibonacci extension. That target near $3.34 has now been met, indicating the pattern played out with precision. This may help chart future targets if volume remains steady.
 Source: X
Whale Moves Create Mixed Sentiment
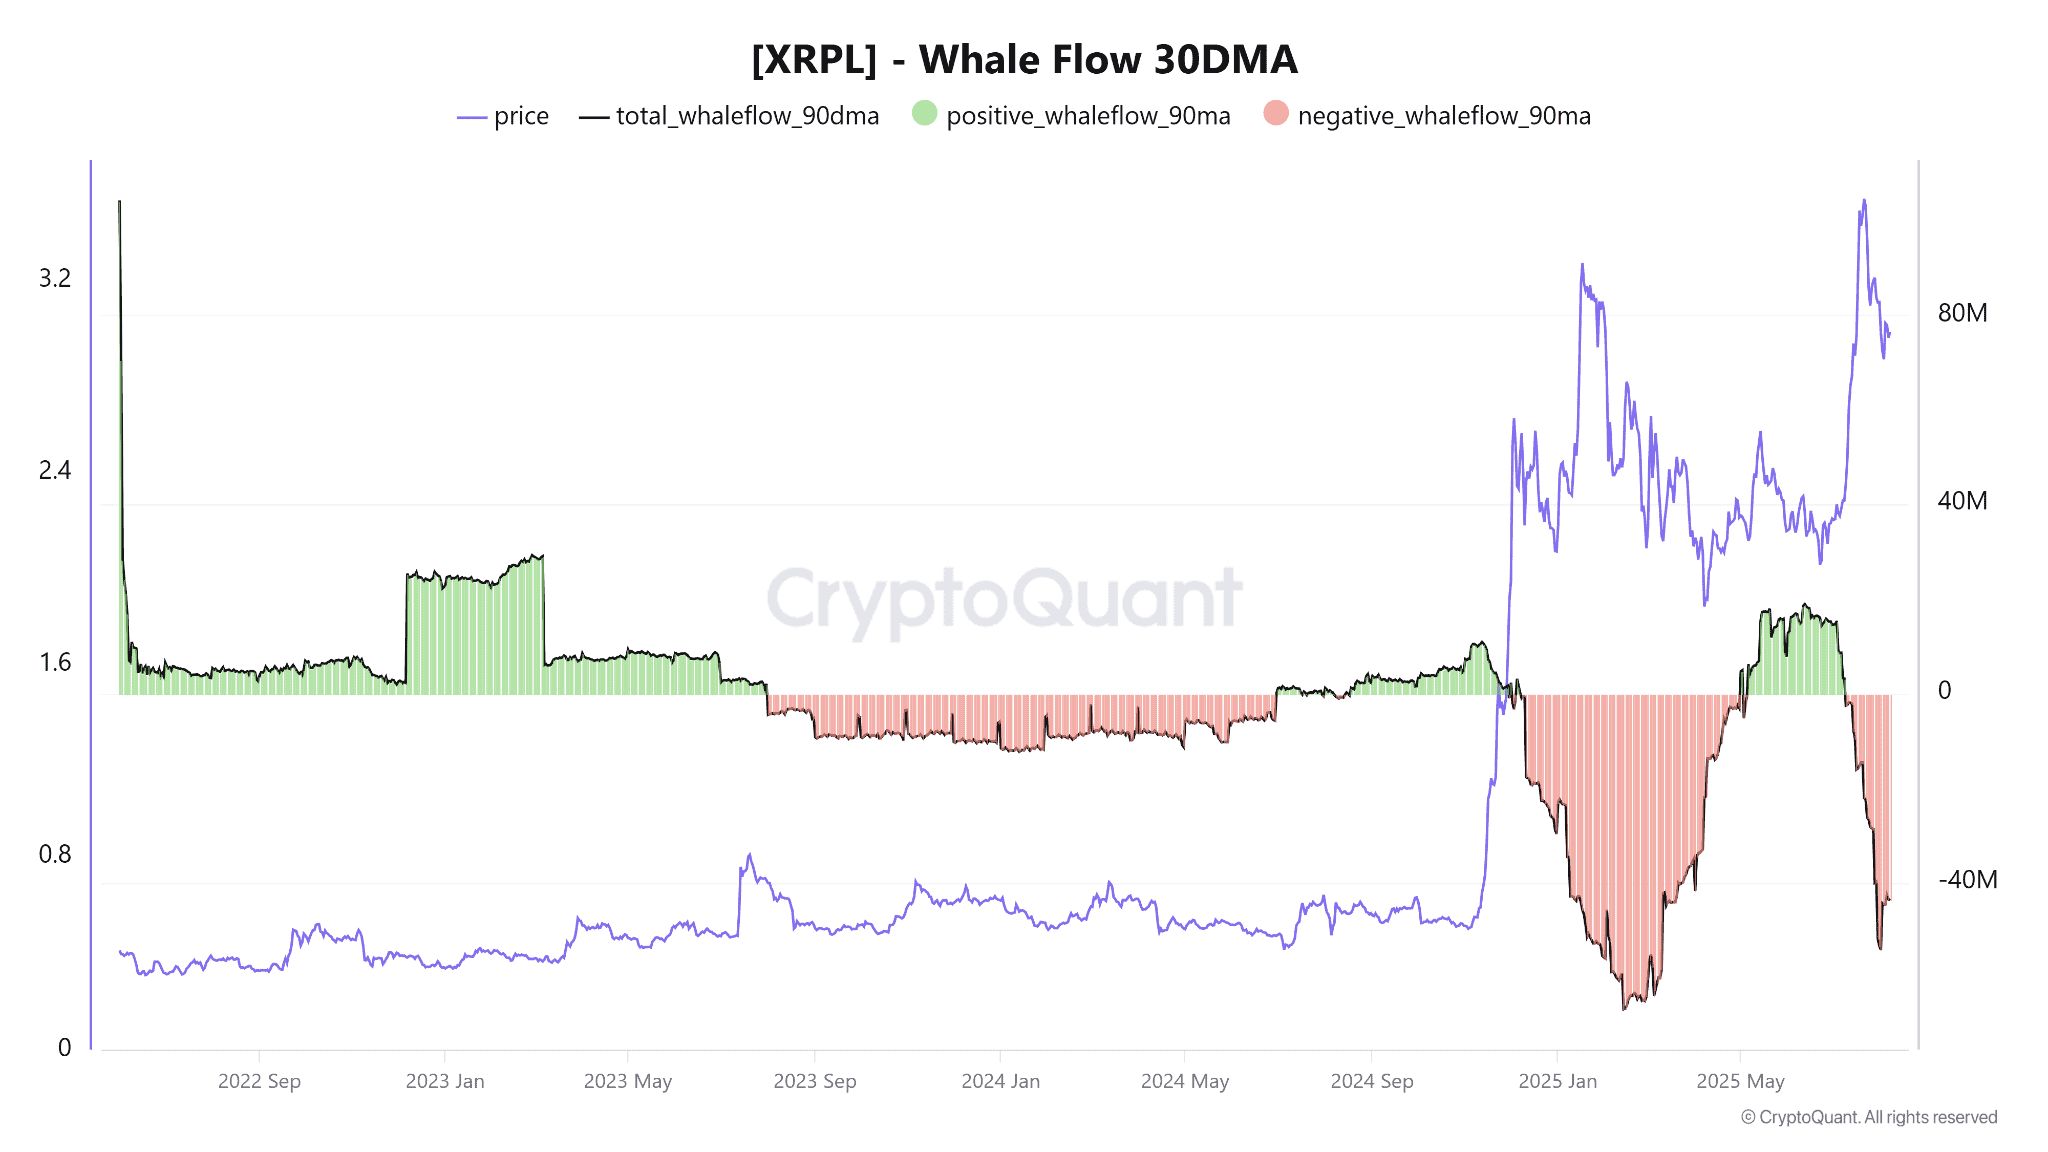
On-chain data from CryptoQuant shows that large XRP holders have been active. In the first week of August, the XRPL Whale Flow indicator turned negative. This metric tracks the difference between inflows and outflows from large wallets. A negative reading suggests more tokens are being moved out than added.
 Source: CryptoQuant
On July 31, analysts recorded over 51,000 large transactions on the network. Four days later, the figure remained high at 38,000. Earlier this year, a similar pattern came before a price drop from $3.40 to around $1.60. That move also saw a spike in large transfers, signaling distribution among major holders.
However, not all movement from whales points to selling. Data also shows that total exchange reserves have fallen. Between July 24 and August 7, XRP held on centralized exchanges dropped from 3.02 billion to 2.3 billion. When large amounts of a token are removed from exchanges, it often suggests holders are choosing to store assets rather than trade them.
If this trend continues, it may lower available supply and ease some of the selling pressure. Still, this must be weighed against high-frequency activity from whale accounts, which may signal further repositioning.
Transaction Activity Picks Up After XRP’s Price Surge
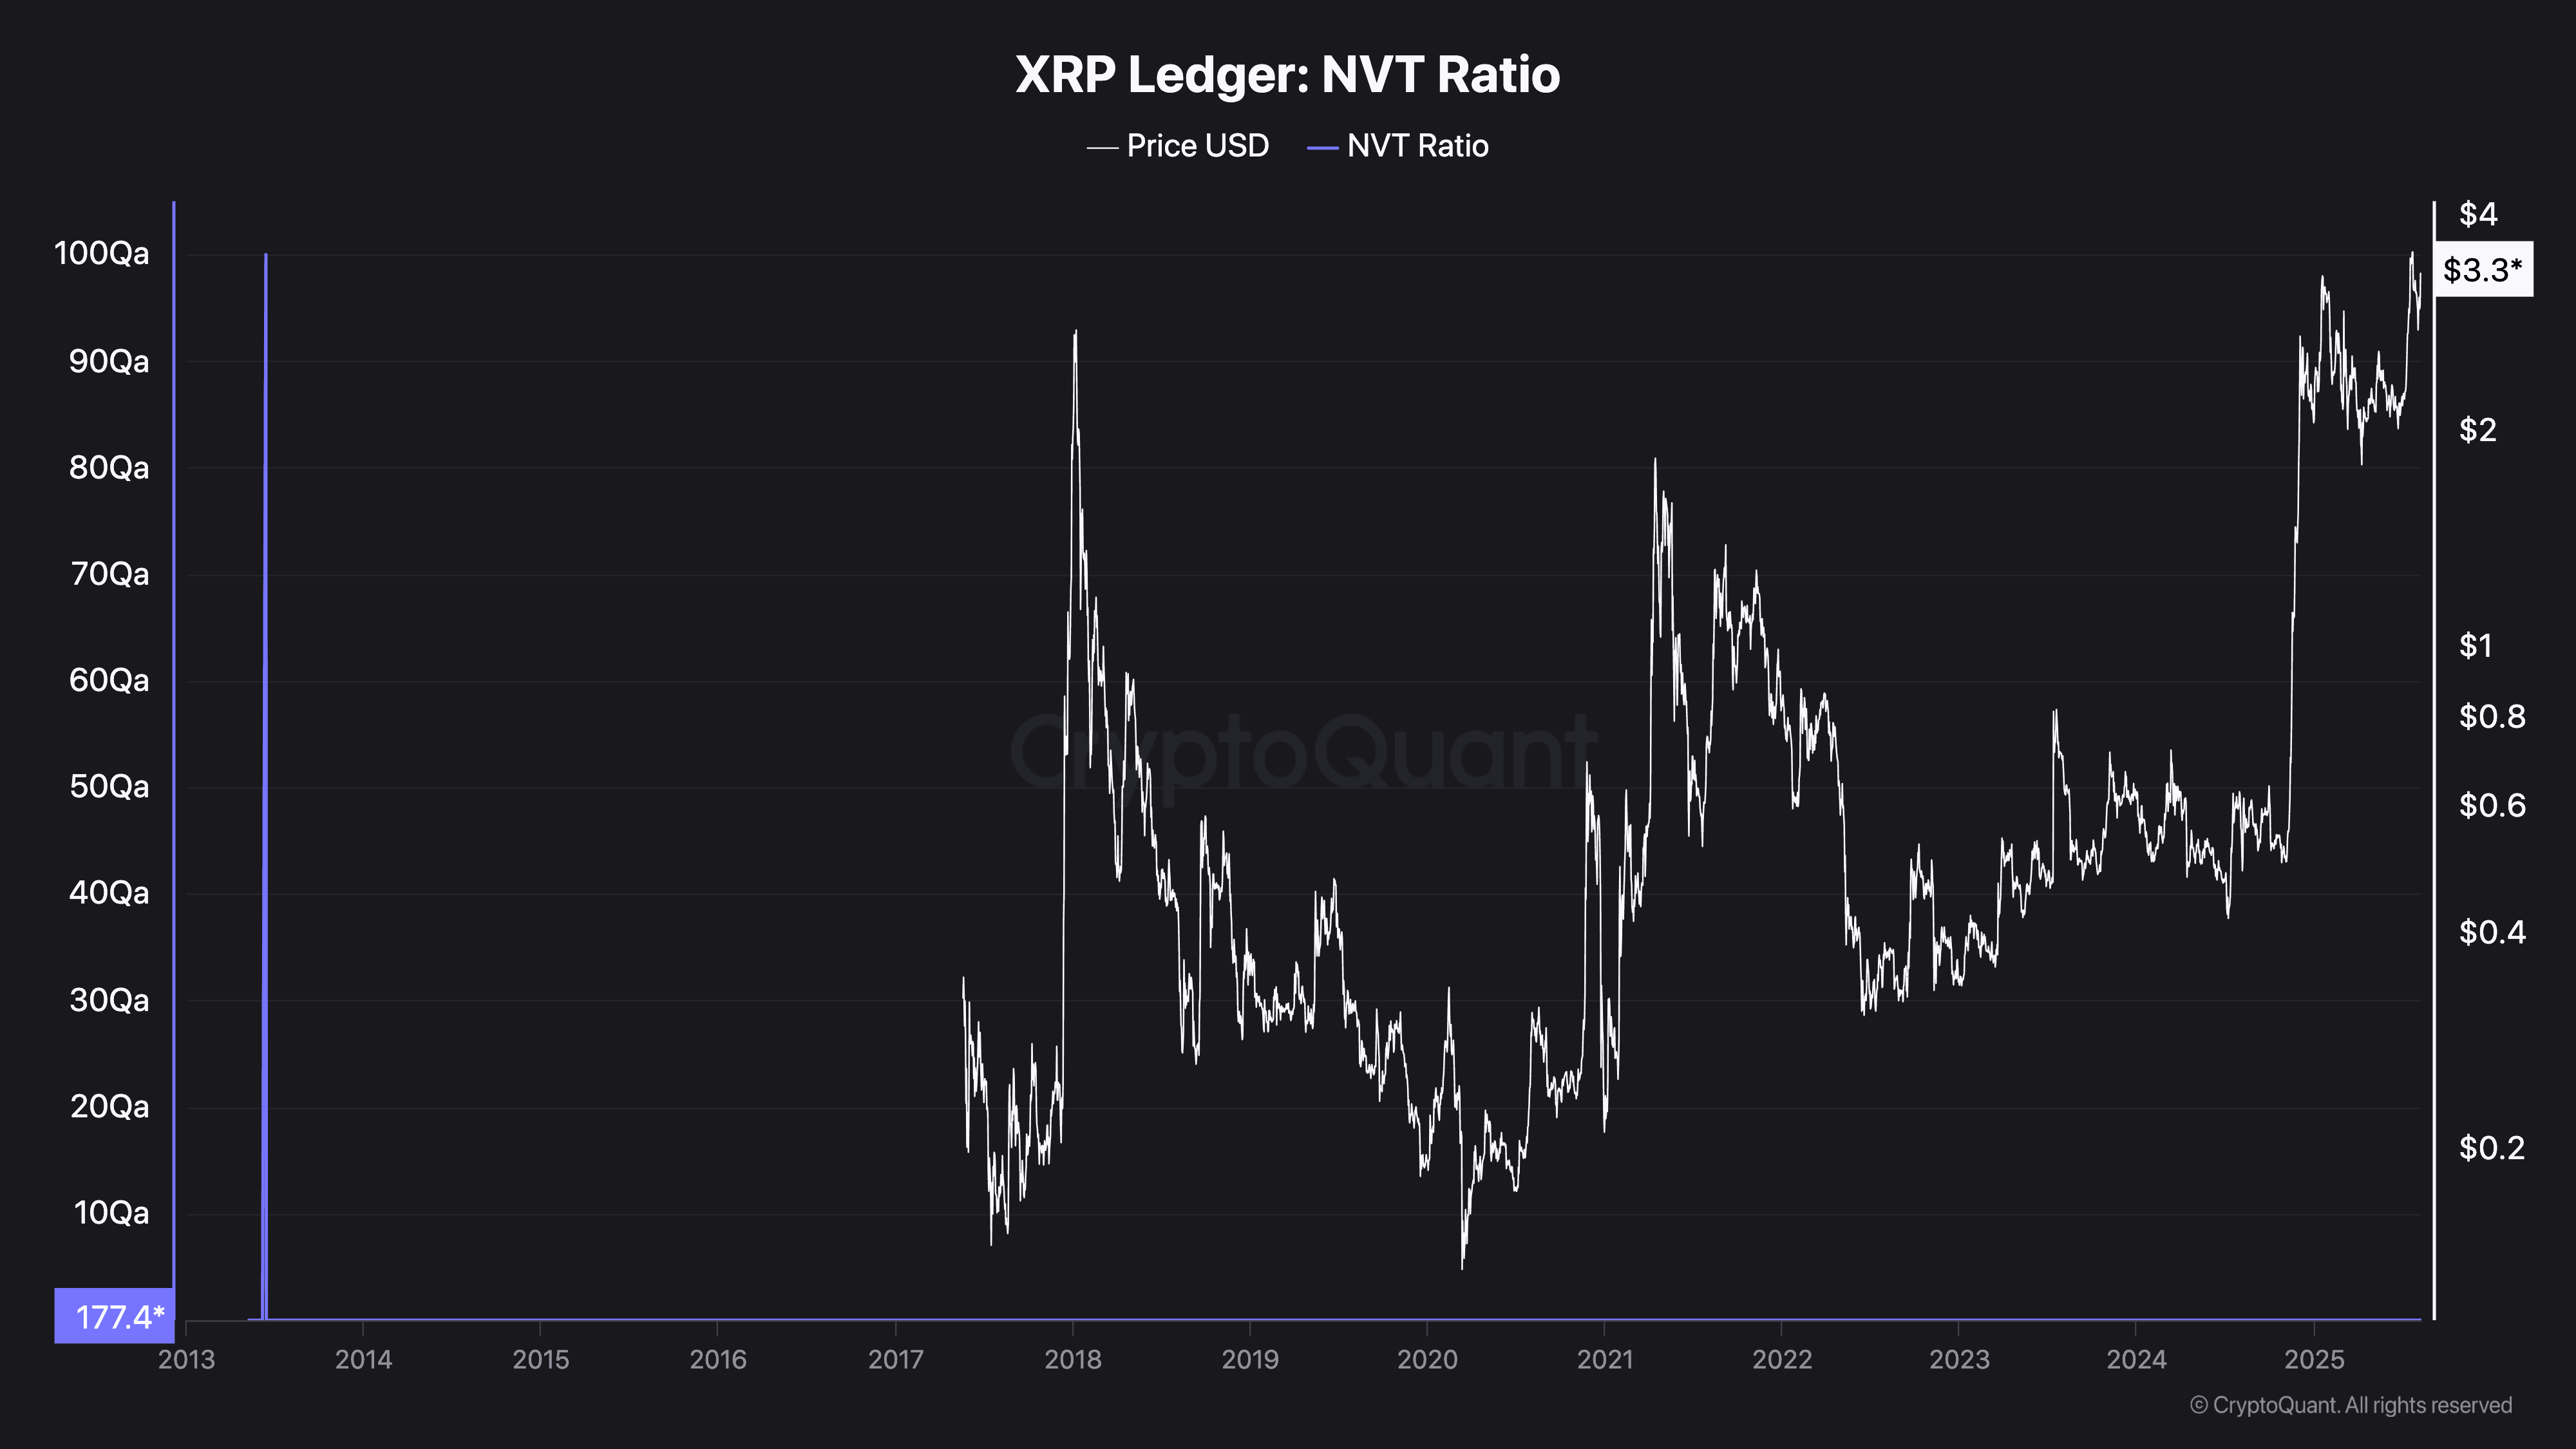
The network value to transactions (NVT) ratio, a measure comparing market cap to on-chain volume, has recently shifted. On August 7, XRP’s NVT ratio reached 225, reflecting a sharp rise in price while transaction activity lagged behind.
As of the latest data, the NVT has pulled back to 177.5, a drop of over 21%. This decline suggests that on-chain usage is starting to catch up with market valuation. The earlier spike in the ratio raised concerns that XRP might be outpacing its real-time utility. The recent drop eases some of those concerns.
 Source: CryptoQuant
This change may signal better alignment between how much XRP is being moved and how the market is valuing it. In previous cycles, a high NVT ratio often came before price corrections. This time, however, the lower reading could mean network activity is recovering after the price jump, supporting the current range.
Do XRP Price Predictions Make Sense?
Price forecasts are often based on technical patterns and market conditions more generally. For XRP, the end of the SEC lawsuit removes one of the key unknowns that had weighed on its valuation.
Short term price predictions may be beneficial, but they are very susceptible to the day-to-day market fluctuations, news activities, and trading patterns.
XRP’s market remains highly reactive to both external developments and on-chain behavior. Several aspects such as liquidity, macro market trends, and investor sentiment should be always termed in predictions.
How Are Ripple Price Predictions Made?
Forecasts for XRP come from a mix of technical, fundamental, and on-chain tools. Support and resistance, Fibonacci retracements, and moving averages are commonly used by chart analysts to project possible ranges. Breakout patterns such as triangles or flags as well as volume and volatility are also common.
On-chain signals such as the whale flows, exchange balances, and volume can be used to gauge what the big fish players are up to, and whether tokens are being stacked up or unstocked. Together with their technical patterns, these signals may be able to give a more complete picture.
Fundamentally, traders monitor the progress made in the business processes of Ripple, collaboration with other properties, as well as changes in regulation. As a matter of legal clarity, it can be expected that the focus will move on the adoption rates and institutional use, particularly on cross-border payment corridors.
The post Ripple (XRP) Price Predictions: $4 in Sight After Ripple’s SEC Victory? appeared first on CryptoPotato.


