
Bitcoin has reclaimed the crucial $115,000 level after briefly dipping to $112,000 earlier this week, signaling renewed strength from the bulls. The sharp recovery highlights buyers’ resilience following recent volatility, with price action now showing signs of bullish dominance. This rebound comes as traders and investors brace for the potential next leg up, eyeing higher resistance levels.
Key market data adds weight to the bullish case. The Bitcoin Futures Open Interest Net Position — a closely watched indicator that tracks the balance between long and short positions — has shifted in favor of the bulls, showing a clear edge over shorts. This change in positioning suggests that sentiment is turning more optimistic, with market participants increasingly betting on further upside.
However, while momentum is building, the coming days will be decisive. Bitcoin must maintain its hold above the $115K level to confirm this shift and open the door to a push toward the next major resistance. Failure to do so could invite fresh selling pressure, putting the recent gains at risk. For now, market structure and derivatives data suggest that bulls are in control, and the stage is set for Bitcoin’s next significant move.
Bitcoin Market Sentiment Shifts as Technical and Fundamental Tailwinds Align
According to top analyst Axel Adler, Bitcoin’s market structure is undergoing a notable shift. After a prolonged bearish regime since late July — marked by sustained short pressure and represented in the red zone — the SMA-120 line for the Bitcoin Futures Open Interest Net Position has reversed upward, reaching the neutral zero mark. This indicator, which reflects the balance between long and short positioning, signals that the market has moved from aggressive short dominance to a neutral-bullish stance.
Adler notes that a similar reversal attempt occurred just a week ago but failed to hold, leading to renewed selling pressure. This time, if the SMA-120 remains above zero for another two consecutive days, it would confirm a regime change, potentially paving the way for a more sustained bullish phase.
On the fundamental side, momentum is being supported by a major policy development: US President Donald Trump has signed an executive order permitting alternative assets, including cryptocurrencies, to be included in 401(k) retirement plans. This landmark decision could open the door for millions of Americans to gain exposure to Bitcoin and other digital assets through their retirement savings, significantly expanding potential demand.
BTC Tests Key Liquidity Levels
Bitcoin’s daily chart shows a strong recovery after recently dipping to the $112K region, with bulls reclaiming the critical $115,724 support level. The rebound has pushed BTC toward the $116,700 area, signaling renewed buying interest after a period of panic selling.
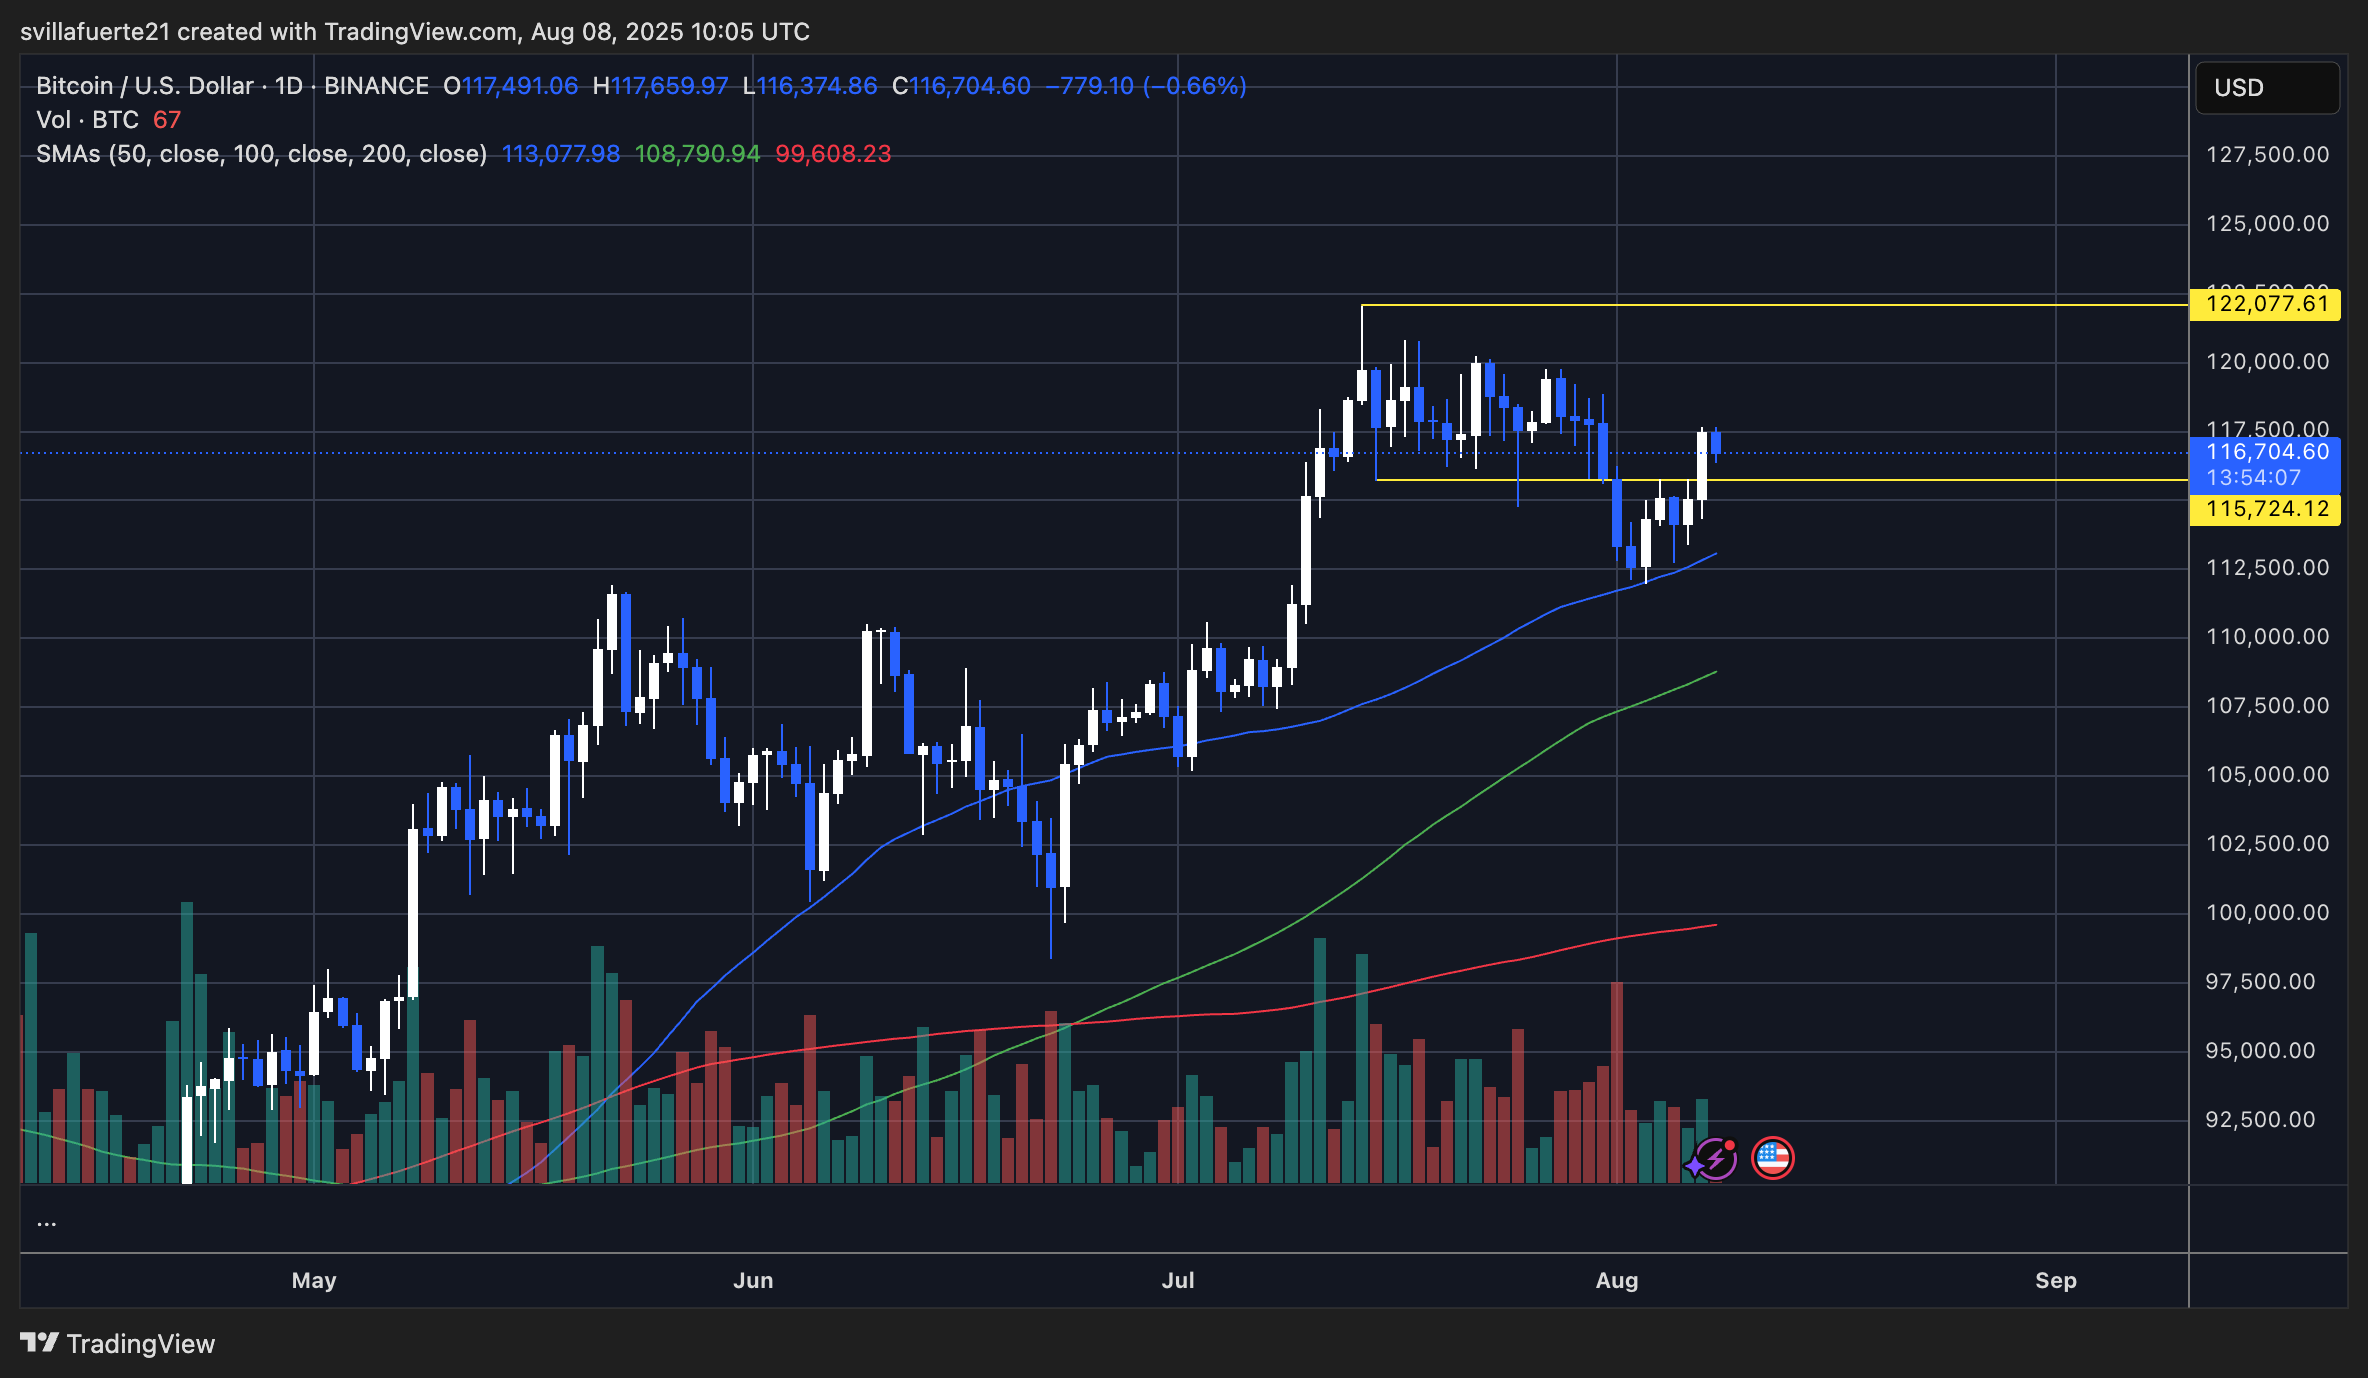
The 50-day SMA (blue) is currently providing dynamic support near $113K, helping reinforce the bullish case in the short term. Above, the next major resistance is at $122,077, which marks the upper boundary of the recent consolidation range. A decisive breakout above this level could open the door for a retest of all-time highs.
The market’s bias leans bullish as long as BTC remains above the 50-day SMA, but traders should watch for momentum signals. If price gains slow while approaching $122K, the risk of a pullback grows. Overall, BTC’s current structure reflects a market attempting to shift back into a bullish posture, with $115,724 acting as the key line in the sand for trend continuation.
Featured image from Dall-E, chart from TradingView


